Where People Are Served
This page shows average number of regional center consumers receiving services statewide. In the last six years, there was an increase in individual placement supported employment, which is Competitive Integrated Employment (CIE). However, in 2023 there were only 50 more people in CIE than there were in 2018. There are far fewer people in group supported employment, and the number of people choosing Work Activity Programs (WAP) continues to decrease. Day and look alike day programs have increased over the years, but are showing a decline between 2019 and 2023.
Many day and look alike programs offer limited work experience to their clients. However, there is no data on how many clients work through these programs, how many hours a week they work, or what their hourly earnings are.
What this page shows us: Even though people want to work, and we know how to support them to work, the vast majority of service growth has been largely non-work programs. This means that most people who become adults go into non-work programs instead of employment services.
| Fiscal Year | Supported Employment Programs Individual | Supported Employment Programs Group | WAP | Day & Look Alike Programs |
|---|---|---|---|---|
| 08/09 | 5,065 | 5,863 | 11,110 | 51,067 |
| 09/10 | 4,841 | 5,903 | 10,826 | 53,056 |
| 10/11 | 4,684 | 5,932 | 10,610 | 54,387 |
| 11/12 | 4,506 | 5,425 | 10,295 | 56,768 |
| 12/13 | 4,345 | 5,589 | 10,241 | 59,661 |
| 13/14 | 4,341 | 5,729 | 10,035 | 62,862 |
| 14/15 | 4,373 | 5,912 | 9,629 | 66,040 |
| 15/16 | 4,462 | 5,986 | 9,141 | 69,286 |
| 16/17 | 5,064 | 5,839 | 7,838 | 72,005 |
| 17/18 | 5,787 | 5,700 | 6,932 | 71,372 |
| 18/19 | 6,542 | 5,441 | 6,122 | 74,014 |
| 19/20 | 6,860 | 5,145 | 4,874 | 73,986 |
| 20/21 | 6,353 | 4,486 | 3,789 | 72,251 |
| 21/22 | 6,565 | 4,276 | 2,829 | 71,925 |
| 22/23 | 5,831 | 3,556 | 2,073 | 66,845 |
This page displays the data three ways:
- The table above shows the numbers over the past ten years.
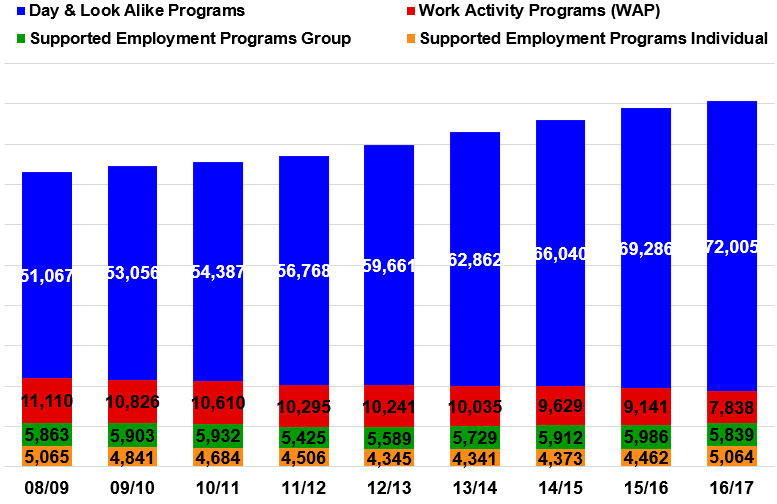
- The bar chart below shows how many people are in each service type, with the integrated employment options being a relatively small number at the bottom.
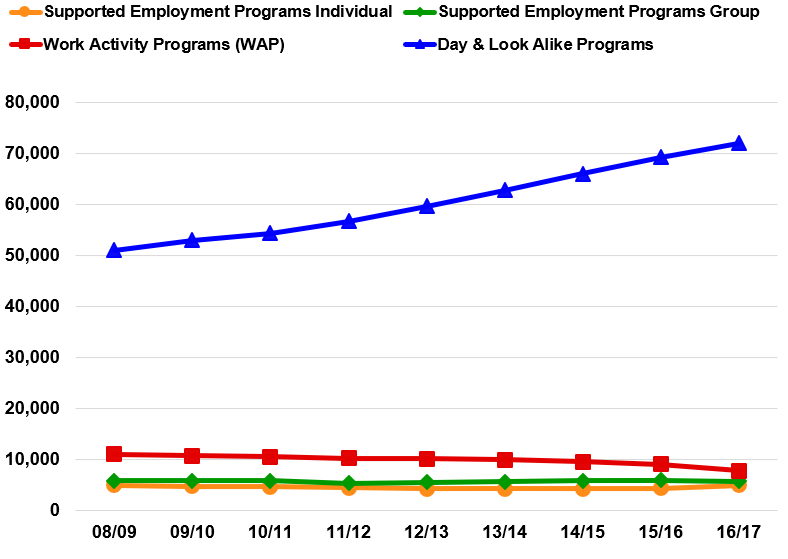
- The line chart below shows that integrated employment options are not going up, sheltered work is going down slowly, and day and look alike programs are increasing rapidly. Therefore, all the growth in working age day services is being absorbed by day and look alike programs.
Note: SEP-G=950, SEP-I=952; WAP=954; Day & Look Alikes: 055,063,505,510,515
Regional Centers have up to 3 years to update their POS data, hence FY 22/23 is incomplete.
Source: DDS Research Section’s Analysis of State Claims File for FY 17/18 through FY 22/23
Data was extracted March 2023