California Employment Rates
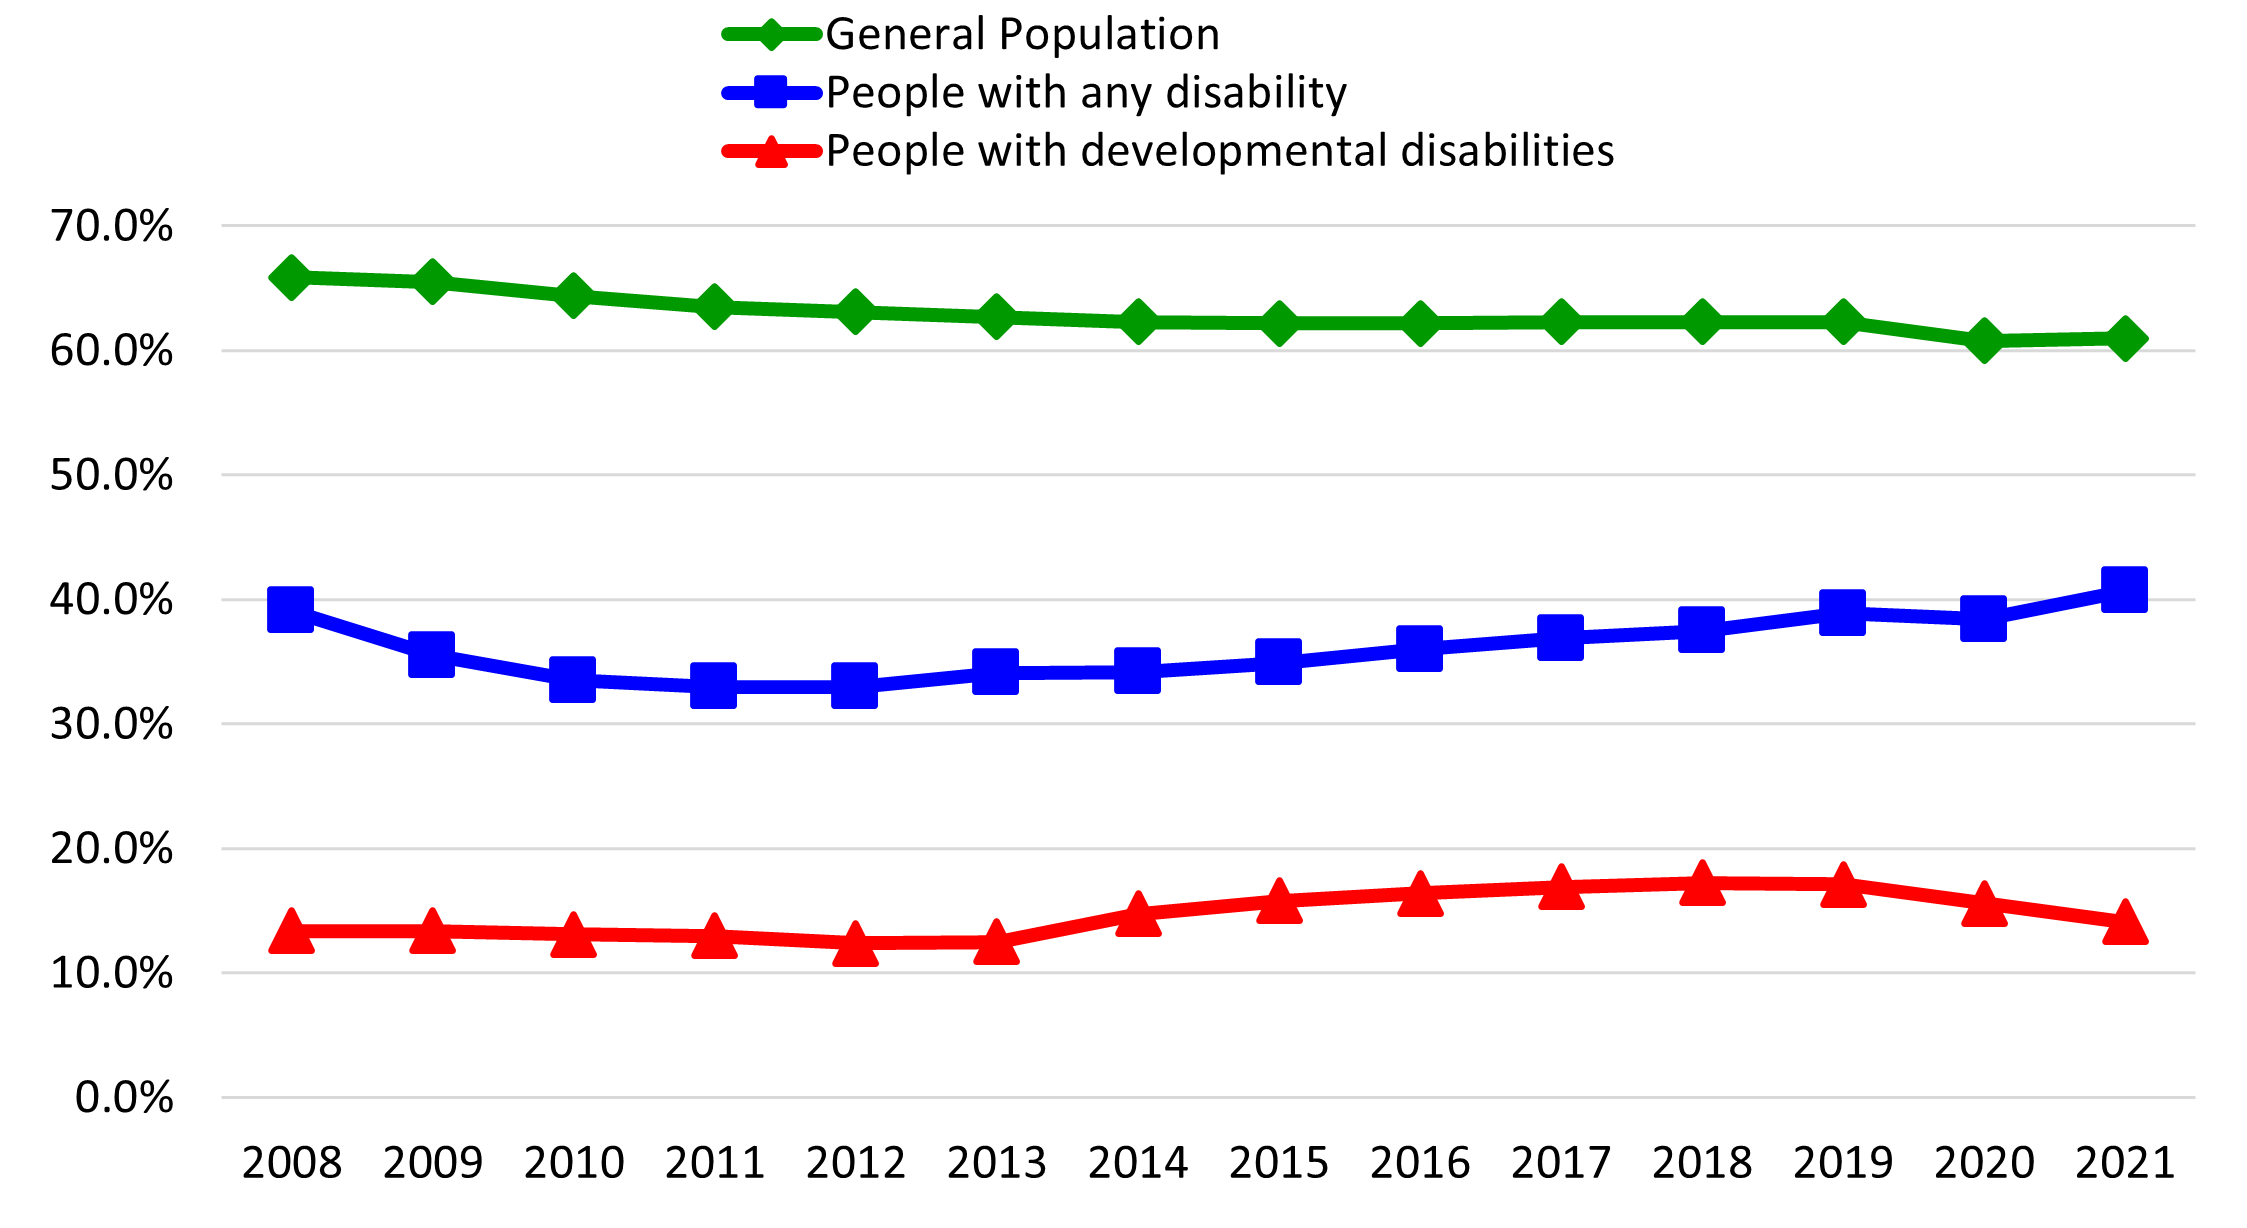
What this page shows us: The California employment rate of people with disabilities is far behind the employment rate for people without disabilities; and the employment rate for people with developmental disabilities is far behind the rate for people with all types of disabilities. The employment rates for the general population and people with disabilities have been going up since the recession. However, the employment rate for people with disabilities went down at the start of the COVID-19 pandemic, and in 2022 is only slightly higher than it was in 2008.
Table 1: Table of California Employment Rates, General Population vs. People with Any Disability vs. People with Developmental Disabilities.
| Year | General Population1 | People with Any Disability1 | People with Developmental Disabilities2 |
|---|---|---|---|
| 2008 | 65.9% | 39.1% | 13.4% |
| 2009 | 65.9% | 35.5% | 13.4% |
| 2010 | 64.4% | 33.5% | 13.1% |
| 2011 | 63.5% | 33.0% | 13.0% |
| 2012 | 63.1% | 33.0% | 12.4% |
| 2013 | 62.7% | 34.1% | 12.5% |
| 2014 | 62.3% | 34.2% | 14.8% |
| 2015 | 62.2% | 34.9% | 15.8% |
| 2016 | 62.2% | 36.0% | 16.4% |
| 2017 | 62.3% | 36.9% | 16.9% |
| 2018 | 62.3% | 37.5% | 17.2% |
| 2019 | 62.3% | 38.9% | 17.1% |
| 2020 | 60.8% | 38.4% | 15.6% |
| 2021 | 61.0% | 40.7% | 14.1% |
| 2022 | 61.9% | – | 13.8% |
Footnote: General population’s employment data is from the Western Information Office, Labor Force Statistics (https://www.bls.gov/regions/west/california.htm#tab-2). Employment rates among population with disabilities is from the Annual Disability Statistics Compendium (https://disabilitycompendium.org/annualreport). Data provided by the California Employment Development Department (EDD). California EDD data reflects wages reported to EDD for the purpose of Unemployment Insurance reporting.
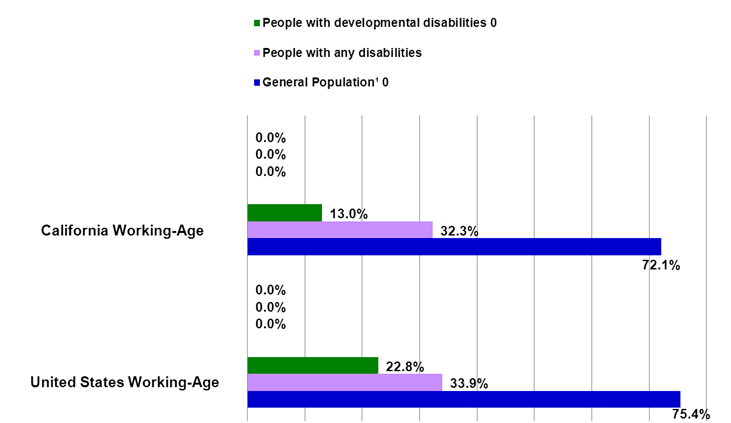
CA Employment Rate vs U.S. Employment Rate (2010)
CA vs US Employment Rates (2010)
The yearly analysis from Cornell University of working age (21-64) people with disabilities, compared to those without, provides the opportunity to measure California results to the United States. The University of Massachusetts, Boston, StateData report provides a statistical analysis of US individuals with cognitive disability working age (16-64) who are employed. Using the data collected from California Department of Employment (EDD), California Department of Developmental Services (DDS) compares California to the US results to get a fair measurement of the disability employment rate.
| United States Working-Age | California Working-Age | |
|---|---|---|
| General Population 1 | 75.4% | 72.1% |
| People with any disabilities | 33.9% | 32.3% |
| People with developmental disabilities | 22.8% 2 | 13.0% 3 |
**Please see footnotes for Working-Age
Footnote: 1 The data was supplied by Erickson William, Research Specialist of Cornell University, based on analysis of the US Census Bureau’s 2010 American Community Survey (ACS) Public Use Micro Data Sample (PUMS). The data reflects non-institutionalized working-age people (21-64) with disabilities who work full-time/full year in the United States. The six types of disabilities included in the data are: sensory, physical, mental, self-care, go-outside-home, and employment.
2 The data is from National Population Statistics Table 2 (22.8%): Employment Participation for Working-Age People (Ages 16 to 64), State Data: The National Report on Employment Services and Outcomes 2011 published by the Institute for Community Inclusion, UMASS. The data reflects individuals with cognitive disability employed in the United States.
3 The data is from Employment Development Department (EDD). CA EDD Data (13%) reflects wages reported to EDD for the purpose of Unemployment Insurance reporting, a limitation of the data as some people have contract earnings that are
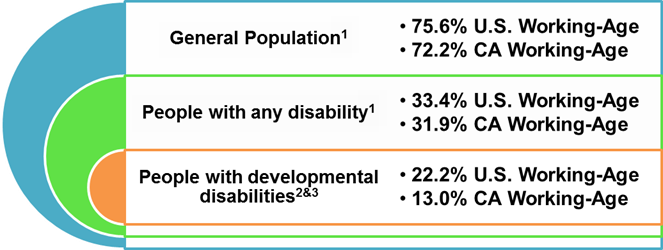
CA Employment Rate vs U.S. Employment Rate (2011)
CA Employment Rate vs U.S. Employment Rate (2011)
**Please see footnotes for Working-Age
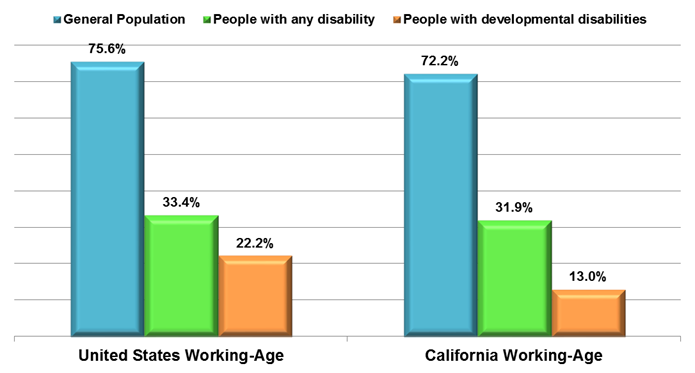
Footnote: 1 The data is from the 2011 Disability Status Report, United States, by Cornell University, based on analysis of the US Census Bureau’s, American Community Survey (ACS), page 8. The data reflects non-institutionalized working-age people (21-64) with disabilities who work full-time/full year in the United States. The six types of disabilities included in the data are: sensory, physical, mental, self-care, go-outside-home, and employment.
2 The data is from National Population Statistics, page 57, Table 2 (22.2%). Employment Participation for Working-Age People (Ages 16 to 64), State Data: The National Report on Employment Services and Outcomes 2012 published by the Institute for Community Inclusion, UMASS. The data reflects individuals with cognitive disability employed in the United States.
3 The data is from Employment Development Department (EDD). CA EDD Data (13%) reflects wages reported to EDD for the purpose of Unemployment Insurance reporting, a limitation of the data as some people have contract earnings that are unreported. End Footnote

CA Employment Rate vs U.S. Employment Rate (2012)
CA Employment Rate vs U.S. Employment Rate (2012)
What this page shows us: The employment rate for the general population and people with disabilities is slightly lower in California than in all of the U.S. However, the employment rate of people with developmental disabilities in California is dramatically less than in the rest of the country.
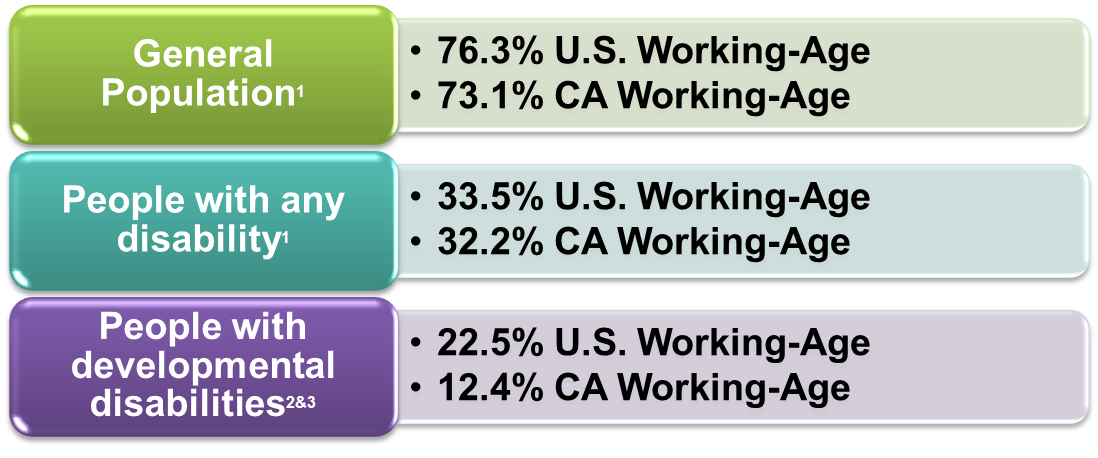
**Please see footnotes for working age
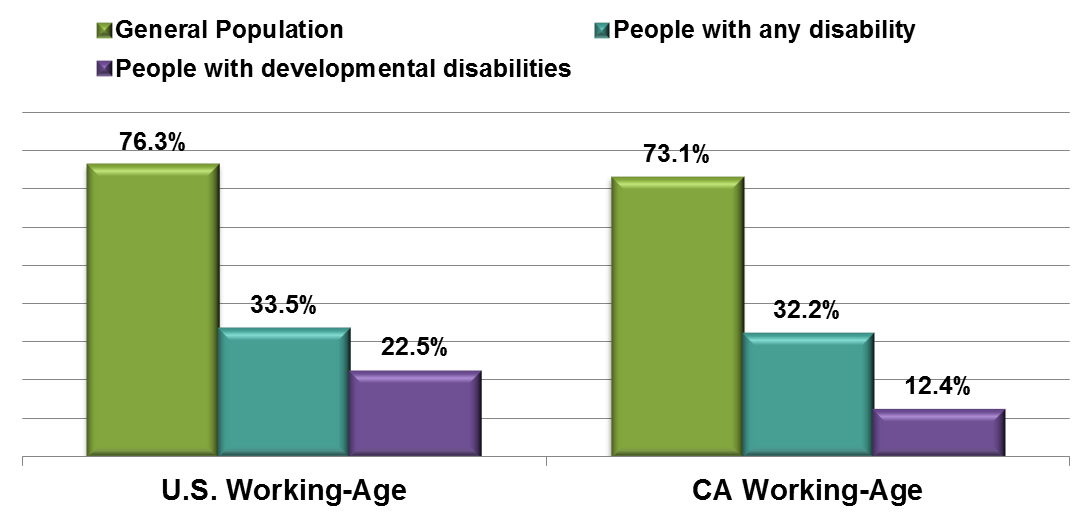
Footnote: 1The data is from the 2012 Disability Status Report, United States, by Cornell University, by calendar year based on analysis of the US Census Bureau’s, American Community Survey (ACS), page 8. The data for “people with any dsability” reflects non-institutionalized working-age people (21-64) with disabilities who work full-time/full year in the United States. Types of disabilities included in the data are: hearing disability, visual disability, cognitive disability, self-care disability, and independent living disability. The data for “General Population” reflects people without disabilities.
2The data from National Population Statistics, page 57, table 2 (22.5%). Employment Participation for Working-Age People (Ages 16 to 64), StateData: The National Report on Employment Services and Outcomes 2012 published by the Institute for Community Inclusion, UMASS. The data reflects individuals with cognitive disability employed in the United States.
3The Data is from Employment Development Department (EDD). CA EDD data is by calendar year (12.4%) and reflects wages reported to EDD for the purpose of unemployment insurance reporting. There is a limitation of the data, as some people have contract earnings that are unreported. End of footnote.
CA Employment Rate vs U.S. Employment Rate (2013)
CA Employment Rate vs U.S. Employment Rate (2013)
What this page shows us: The employment rate for the general population and people with disabilities is slightly lower in California than in all of the U.S. However, the employment rate of people with developmental disabilities in California is dramatically less than in the rest of the country.
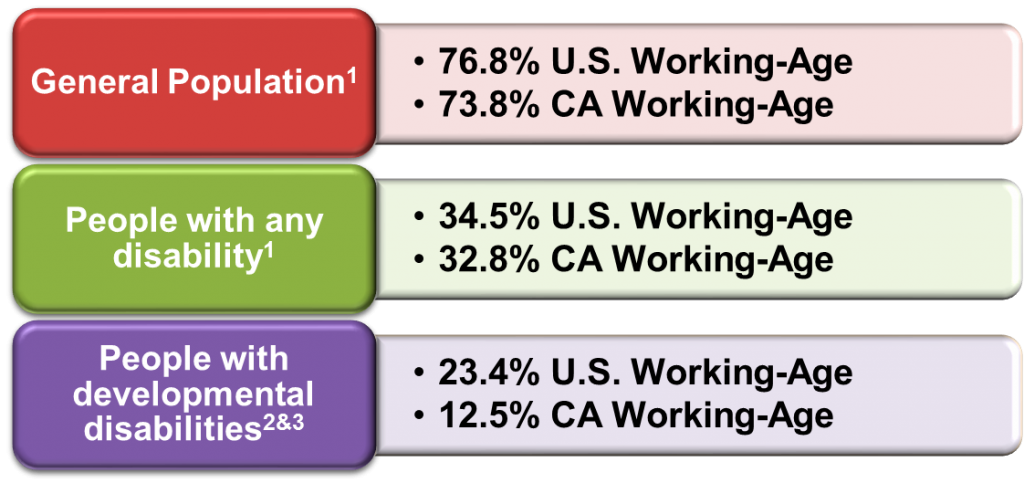
**Please see footnotes for working age
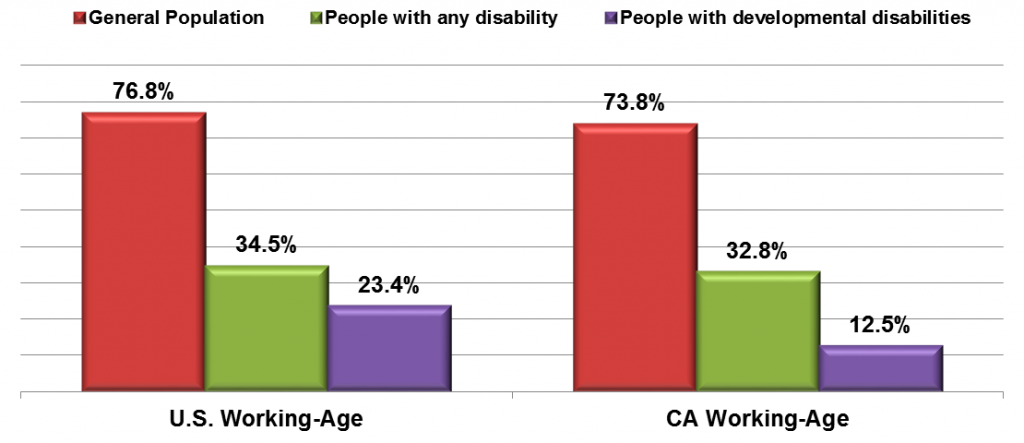
Footnote:1The data is from the 2013 Disability Status Report, United States, by Cornell University, by calendar year based on analysis of the US Census Bureau’s, American Community Survey (ACS). The data reflects non-institutionalized working-age people (21-64) with disabilities who work full-time/full year in the United States. Types of disabilities included in the data are: hearing disability, visual disability, cognitive disability, self-care disability, and independent living disability.
2The data is from National Population Statistics, page 49, table 2 (23.4%). Employment Participation for Working-Age People (Ages 16 to 64), StateData: The National Report on Employment Services and Outcomes 2012 published by the Institute for Community Inclusion, UMASS. The data reflects individuals with cognitive disability employed in the United States.
3The data is from Employment Development Department (EDD). CA EDD data is by calendar year (12.5%) and reflects wages reported to EDD for the purpose of unemployment insurance reporting. There is a limitation of the data, as some people have contract earnings that are unreported. End of footnote.
CA Employment Rate vs U.S. Employment Rate (2014)
CA Employment Rate vs U.S. Employment Rate (2014)
What this page shows us: The employment rate for the general population and people with disabilities is slightly lower in California than in all of the U.S. However, the employment rate of people with developmental disabilities in California is dramatically less than in the rest of the country.
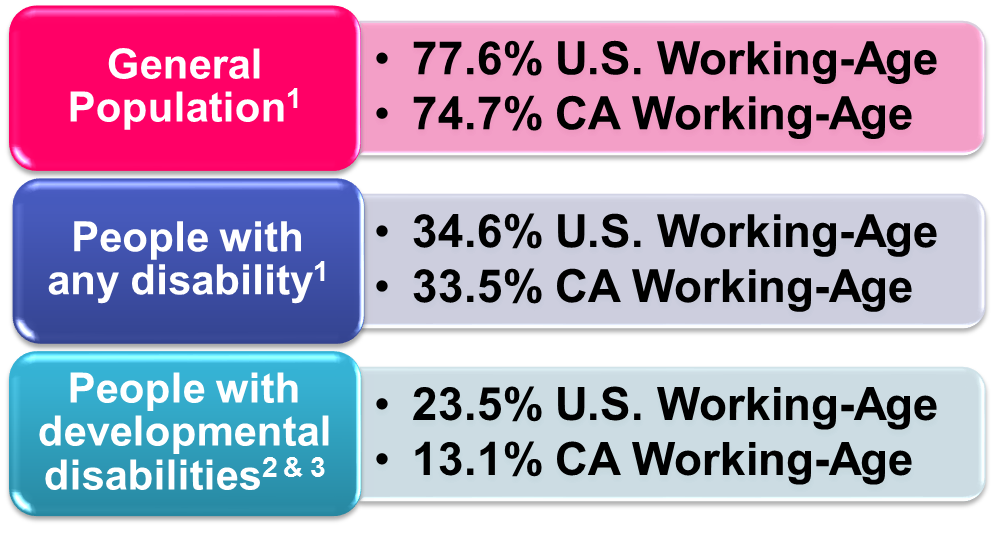
**Please see footnotes for working age
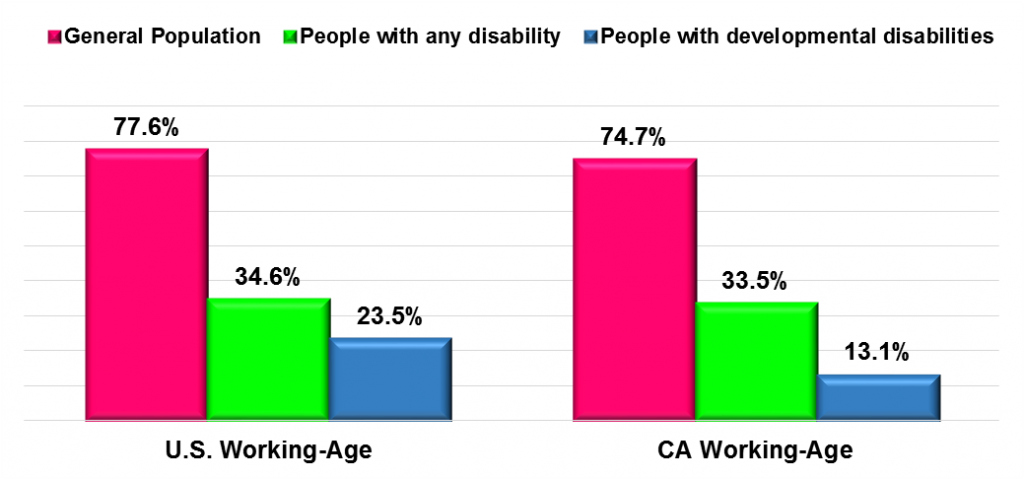
Footnote: 1The data is from the 2014 Disability Status Report, United States, by Cornell University, by calendar year based on analysis of the US Census Bureau’s, American Community Survey (ACS). The data reflects non-institutionalized working-age people (21-64) with disabilities who work full-time/full year in the United States. Types of disabilities included in the data are: hearing disability, visual disability, cognitive disability, self-care disability, and independent living disability.
2The data is from National Population Statistics, page 57, table 2 (23.5%). Employment Participation for Working-Age People (Ages 16 to 64), StateData: The National Report on Employment Services and Outcomes 2014 published by the Institute for Community Inclusion, UMASS. The data reflects individuals with cognitive disability employed in the United States.
3The data is from Employment Development Department (EDD). CA EDD data is by calendar year (13.1%) and reflects wages reported to EDD for the purpose of unemployment insurance reporting. There is a limitation of the data, as some people have contract earnings that are unreported. End of footnote.