How Many Earned Wages
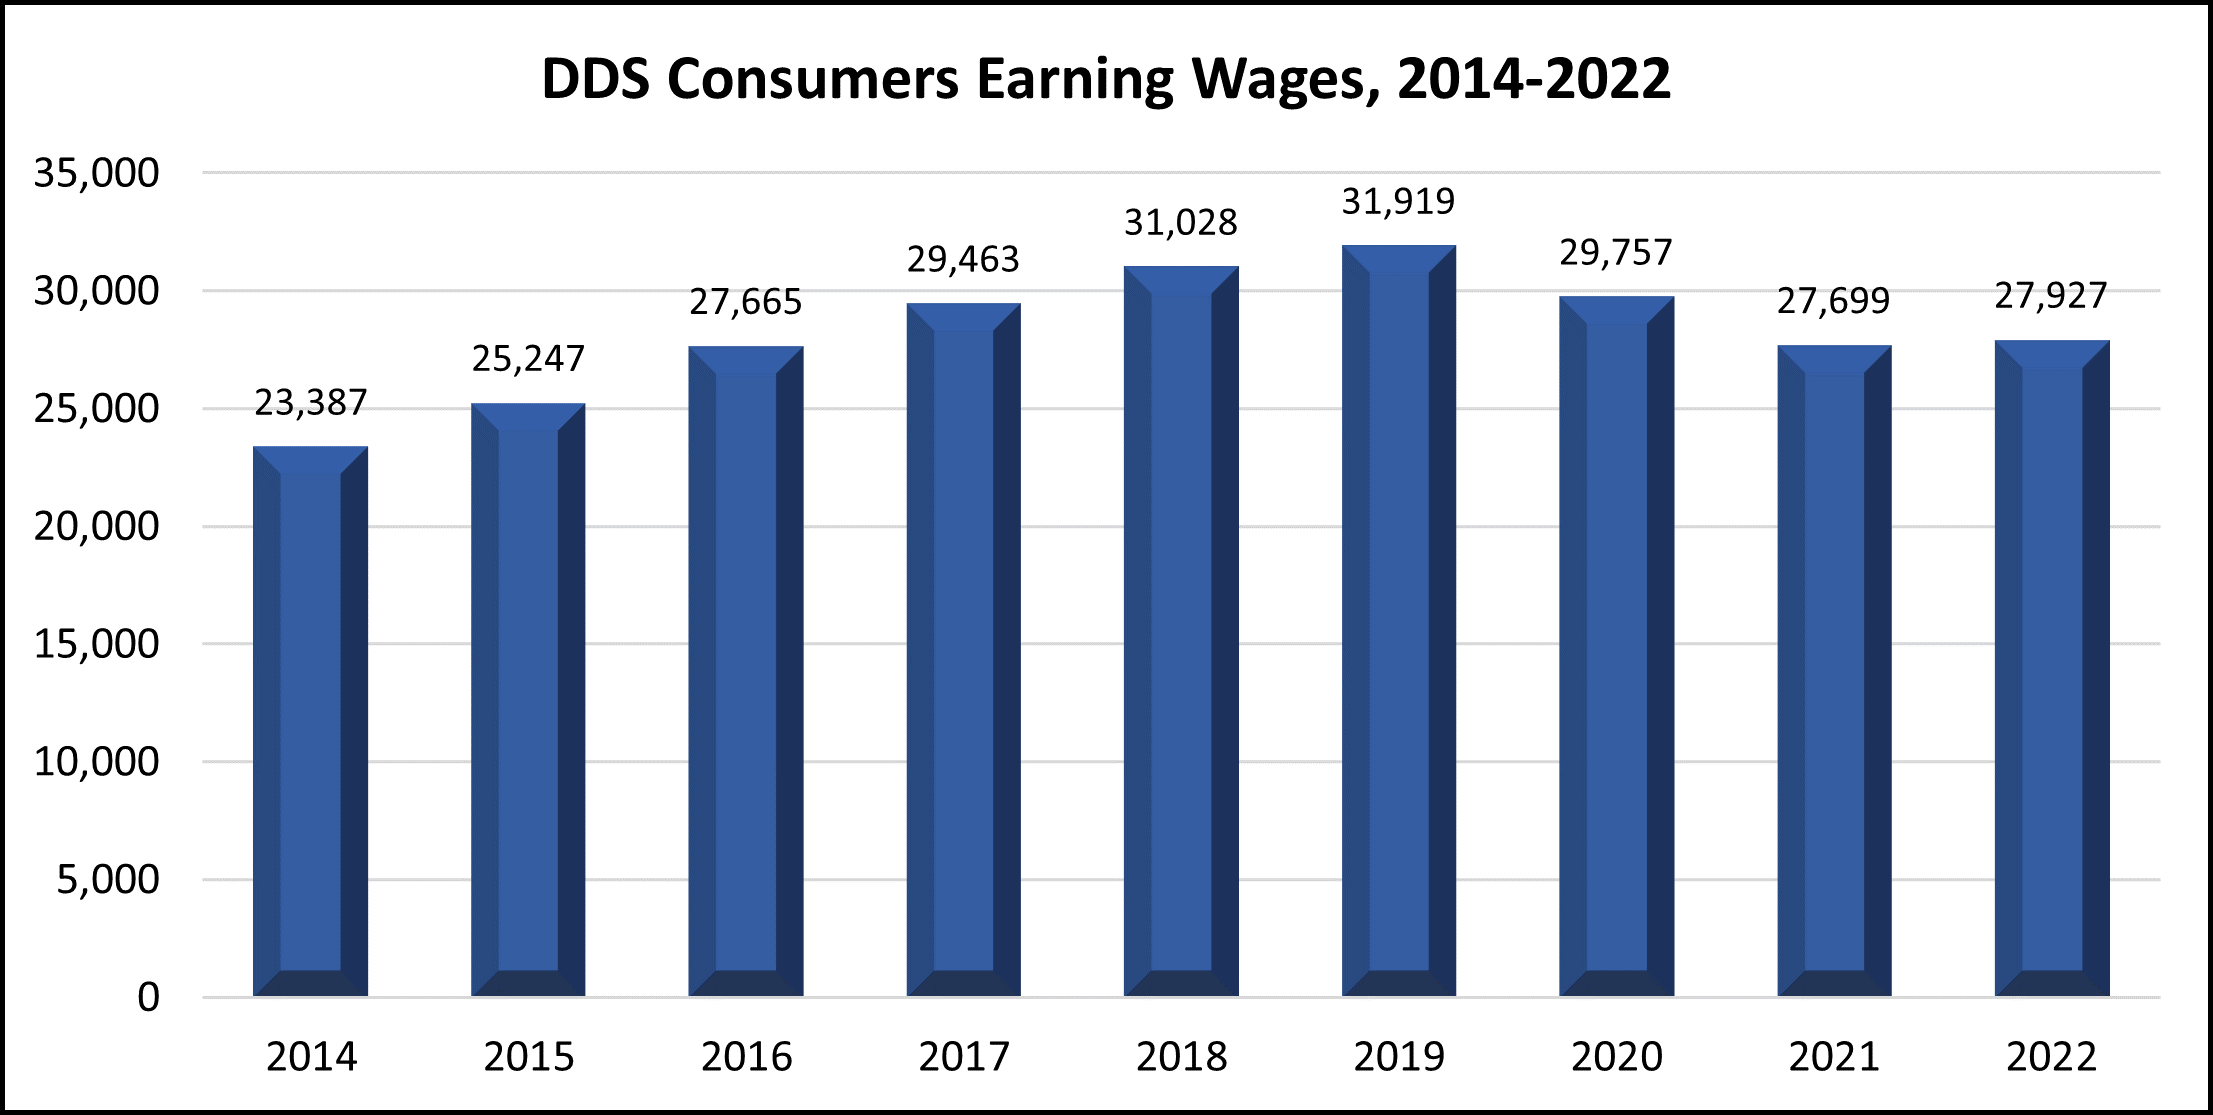
What this page shows us: This page shows how many working age regional center clients have earned money in each of the last nine years. The number of people making money stayed about the same during and after the great recession. Since the passage of California’s Employment First Policy in 2013, the number of people making money steadily increased until the COVID-19 pandemic began in 2020.
201419,021
| Year | Number of Consumers Receiving Wages |
|---|---|
| 2014 | 23,387 |
| 2015 | 25,247 |
| 2016 | 27,665 |
| 2017 | 29,463 |
| 2018 | 31,028 |
| 2019 | 31,919 |
| 2020 | 29,757 |
| 2021 | 27,699 |
| 2022 | 27,927 |
![]() View Average Monthly Earnings Data
View Average Monthly Earnings Data
Footnote: Data from the California Employment Development Department (EDD). CA EDD data reflects the average annual wages reported to EDD for the purpose of Unemployment Insurance reporting.
Technical notes:
Starting from CY2014, EDD data on individual level was provided to the Work Services Team, which allows us to analyze the data on UCI level. Old aggregated data was replaced and corrected.
Source: DDS Research Section’s Analysis of Employment Data (2018-2022) Provided by the Work Services Team