Average Monthly Earnings
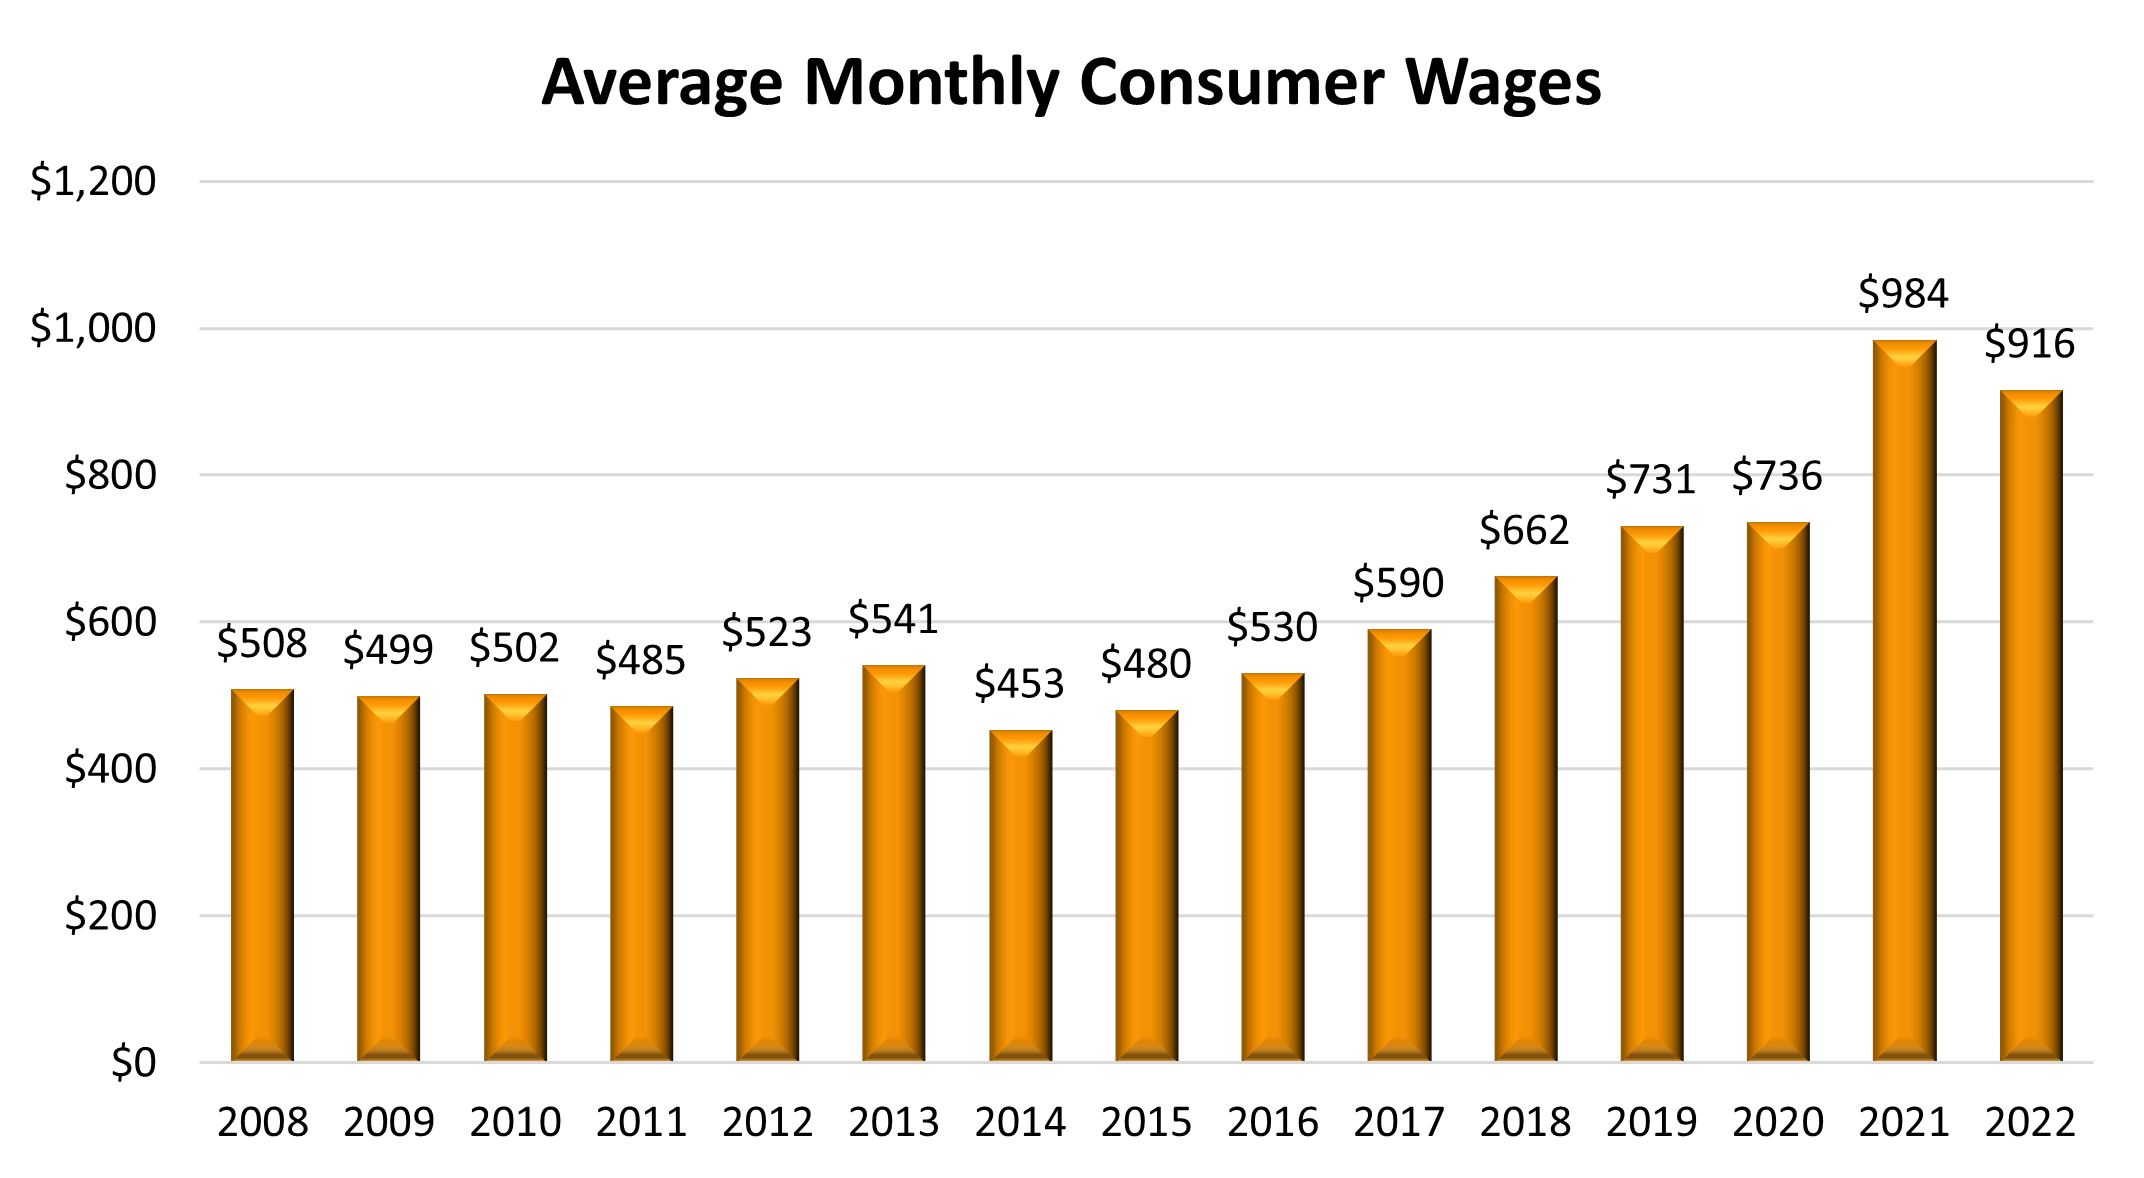
For those regional center clients who did receive a pay check, the table and chart below shows their average monthly earnings over the last eight years.
What this page shows us: Even regional center consumers who are making money appear to be under-employed, as their average earnings are very low.
The great recession had its biggest impact on working age regional center clients, not in how many had jobs, but in how much they made. While many kept jobs, on average they either worked fewer hours or were paid less.
The bar chart shows that wages did not go up during and after the great recession. However, wages have slowly increased in the last few years..
| Year | Average Monthly Consumer Wages |
|---|---|
| 2008 | $508 |
| 2009 | $499 |
| 2010 | $502 |
| 2011 | $485 |
| 2012 | $523 |
| 2013 | $541 |
| 2014 | $453 |
| 2015 | $480 |
| 2016 | $530 |
| 2017 | $590 |
| 2018 | $662 |
| 2019 | $731 |
| 2020 | $736 |
| 2021 | $984 |
| 2022 | $916 |
![]() View Number of Consumers Earning Wages
View Number of Consumers Earning Wages
Footnote: The data is from Employment Development Department (EDD). CA EDD data reflects the average annual wages reported to EDD for the purpose of Unemployment Insurance reporting, a limitation of the data as some people have contract earnings that are unreported. 2022 data is partial and not completed.
Technical notes:
Starting from CY2014, EDD data on individual level was provided to the Work Services Team, which allows us to analyze the data on UCI level. Old aggregated data was replaced and corrected. Due to the limit of EDD data which was only collected at CY quarterly level, monthly average wage for each UCI was derived using the year total wages divided by 12.
Source: DDS Research Section’s Analysis of Employment Data (2018-2022) Provided by the Work Services Team