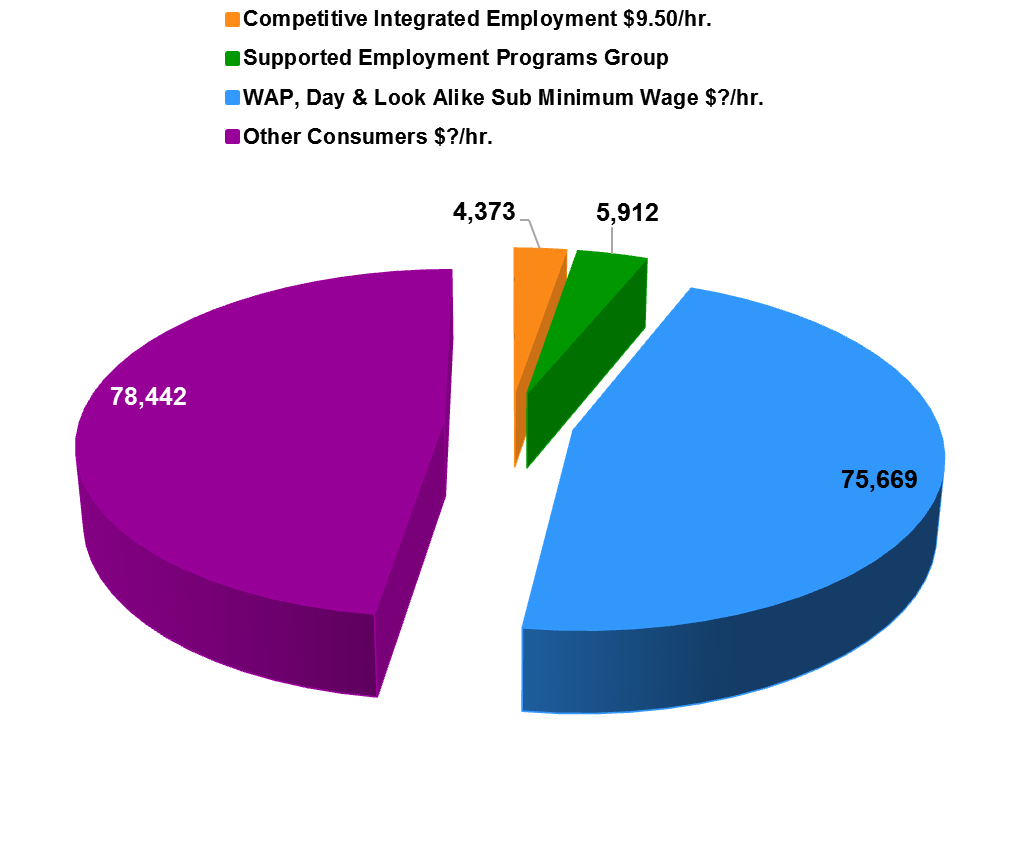
Average Hourly Wage
In 2011, California asked about 8,400 regional center clients if they worked, and, if they did, how much they earned. People working in regular integrated jobsmade on average $9.89/hour, while people working in small groups made about $6.24/hour. This means that people in regular integrated jobs made, on average, $3.65/hour more than people in groups. This is 58% more per hour.
| Competitive Integrated Employment $9.50/hr | Supported Employment Programs Group $6.00/hr | WAP, Day & Look Alike Sub Minimum Wage $?/hr | Other Consumers $?/hr |
|---|---|---|---|
| 4,373 | 5,912 | 75,669 | 78,442 |
In 2011, only 4,505 working age regional center clients had regular integrated jobs and only 5,425 worked in group supported employment. Over 67,000 attended day programs, Work Activity Programs (WAP), and look alike day programs; most of those were not working, and many of those that do work earn less than minimum wage. Over 69,000 other regional center clients of working age are not served in any of these options.
What this page shows us: There are not many people in Competitive Integrated Employment (CIE). There are only 3.1% of working age regional center clients in regular integrated jobsand 3.7% working in small groups. 93.2% of them are in sheltered work or day services, or have no day services at all. The small slivers of the pie chart below shows how small those percentages are, and how far we have to go to support people in integrated work.

Footnote: The Department of Developmental Services’ data is from the California NCI survey. Due to the size of California and population, California was excluded from the National FY 11/12, and FY 14/15 survey.
The National Core Indicators (NCI) is a standard set of performance measures used by states to determine and track outcomes of services and supports offered to individuals with intellectual/developmental disabilities. Key areas such as employment, service planning, community inclusion, safety, rights, individual choices and health are measured. In California, in alternating years, survey questions are presented to adults with intellectual/developmental disabilities, their family or guardian. All survey participants for that year are administered the same standard questions about how they feel regarding the State services and support received. The results provide the California Department of Developmental Services (DDS) with measurable performance outcomes.End of footnote.


